Interconnected Jackpot Networks: Reshaping Expected Values Through Linked Progressives
Zara Schröder · Jun 12, 2026
Interconnected Jackpot Networks: Reshaping Expected Values Through Linked Progressives
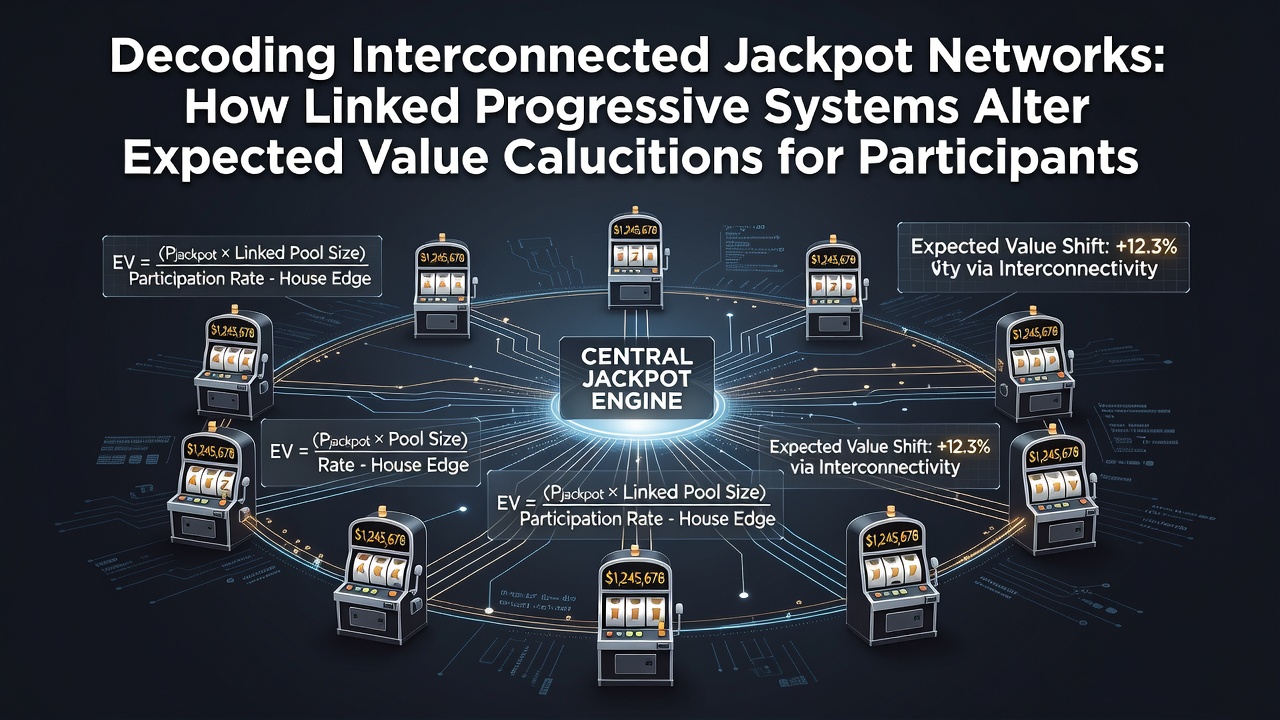
Linked progressive jackpot systems connect slot machines across multiple venues or operators into shared prize pools, and this structure directly modifies how participants calculate expected values compared to standalone machines. Each wager contributes a small percentage to the growing jackpot, yet the networked approach pools those contributions from wider player bases, which shifts the probability distributions and return metrics that analysts track. Observers note that the contribution rate from each bet typically ranges between 0.5 and 2 percent, and when machines link together the total pool accumulates faster while the hit frequency remains governed by fixed random number generator parameters set by manufacturers.
Mechanics of Networked Progressive Pools
Progressive linkages operate through central servers that aggregate meter readings from participating terminals in real time, and this setup requires operators to synchronize contribution percentages across all connected sites. When a player hits the jackpot the entire pooled amount pays out, after which the meter resets to a seed value that often equals several hundred thousand dollars depending on the network scale. Data from regulatory filings shows that larger networks, such as those spanning dozens of casinos in a single state, generate higher average jackpots because daily coin-in volume multiplies across locations; one example includes systems monitored by the Nevada Gaming Control Board where multi-property linkages have produced jackpots exceeding 10 million dollars during peak periods.
The reset seed and increment rates combine to determine the theoretical payback percentage once the jackpot reaches specific thresholds, and players who track these figures adjust their participation decisions accordingly. Because the jackpot component carries a separate expected value that improves as the meter climbs, the overall machine return can temporarily exceed 100 percent at certain break-even points before the next reset occurs.
Adjustments to Expected Value Formulas
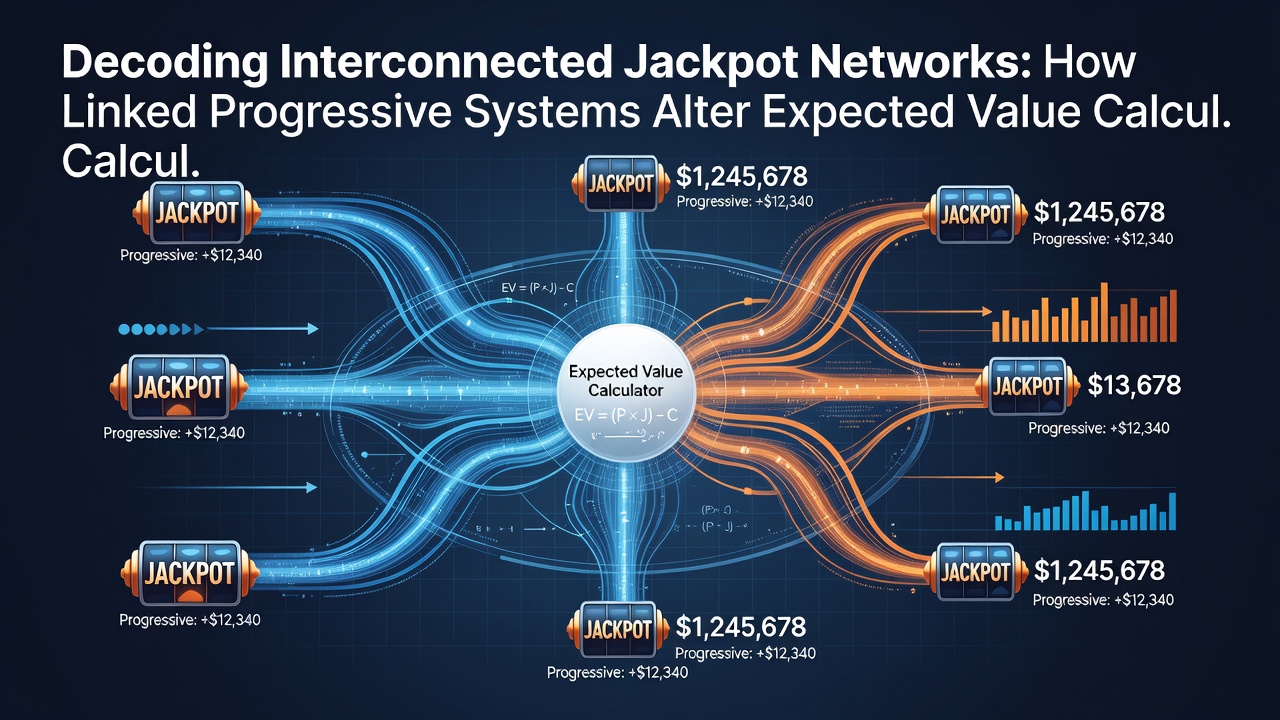
Standard expected value calculations for slot machines incorporate base game returns plus the jackpot contribution weighted by its probability, yet linked progressives introduce an additional variable: the shared pool size that depends on collective play across the network. Analysts therefore revise the formula to include the current meter amount divided by the number of possible outcomes, adjusted for the contribution percentage and the number of active machines feeding the pool. This yields a dynamic expected value that rises and falls with network activity rather than remaining fixed at the machine level.
Studies from academic institutions have examined these dynamics using simulation models that incorporate variable player volumes, and results indicate that networks with higher machine counts accelerate jackpot growth enough to push expected values above the base game return during extended accumulation phases. The probability of hitting the jackpot stays constant per spin, while the payout amount fluctuates, which creates windows where informed participants identify favorable conditions based on publicly displayed meters.
Comparative Analysis Across Jurisdictions
Regional differences appear in how regulators oversee contribution rates and disclosure requirements for linked systems, with some authorities mandating public meter visibility while others focus on minimum seed amounts. Reports compiled by research centers such as the Australian Gambling Research Centre document that networked progressives in multi-venue environments produce larger average payouts yet maintain the same underlying house edge on the non-jackpot portions of each game. Participants who monitor multiple networks simultaneously often compare current meters against calculated break-even points derived from contribution percentages and hit frequencies published in game rules.
Software providers supply the underlying random number generators that determine jackpot triggers independently of the linkage, which means the network only affects the prize size and not the odds of triggering it. This separation keeps the mathematical integrity intact while allowing the pooled contributions to alter the value proposition for players who time their sessions around rising meters. Historical data from operating records reveals that networks reset multiple times per year depending on total coin-in, and each cycle follows predictable accumulation patterns once average daily volumes stabilize.
Practical Implications for Calculation Models
Those modeling player returns incorporate real-time meter data into spreadsheets or custom scripts that recalculate expected values after every significant increase in the pool, and these models account for the time required to reach break-even thresholds given current network participation rates. Because linked systems draw from broader player bases the variance in jackpot size decreases relative to standalone progressives, which in turn smooths the expected value curve over shorter time intervals. Operators publish aggregate contribution statistics in compliance filings, and these figures allow external analysts to estimate network-wide coin-in and project future meter trajectories with reasonable accuracy.
Simulation studies have confirmed that the point at which the jackpot component offsets the base game house edge occurs at different meter levels depending on network size and contribution percentage, and participants who apply these revised calculations adjust their bankroll allocation and session length accordingly. The presence of multiple linked networks within the same jurisdiction creates opportunities to compare expected values across systems in real time, although actual outcomes remain governed by the random number generator on each individual spin.
Conclusion
Linked progressive jackpot networks modify expected value calculations by tying individual machine returns to collective pool accumulation across multiple locations, and this interconnection introduces dynamic thresholds where overall returns shift based on current meter levels and network participation. Regulatory data and simulation research establish that the core probability of hitting the jackpot remains unchanged while the payout amount scales with aggregated contributions, which produces measurable alterations in value calculations that participants can track through publicly available information. As networks continue to expand in various jurisdictions the same principles apply, with updated meter data and contribution rates providing the inputs needed for ongoing expected value assessments.