Let It Ride Poker's Shifting Sands: Paytable Tweaks and Their RTP Ripples Across Digital Tables
Sofia Schmitz · Apr 24, 2026

Let It Ride Poker's Shifting Sands: Paytable Tweaks and Their RTP Ripples Across Digital Tables
The Core Mechanics of Let It Ride Poker
Let It Ride Poker emerged in the mid-1990s as a straightforward casino table game where players wager on five-card poker hands formed by three dealt cards and two community cards revealed sequentially; players place three equal bets upfront, but the game allows retrieval of the first bet after seeing the first community card if holding a pair of 10s or better, and the second bet after both community cards if still holding that qualifying hand, while the third bet rides to the final payout based on the completed hand according to the posted paytable. Data from extensive simulations, such as those run by independent analysts, confirm that strategy revolves around those early retrieval decisions, yet paytable structures dictate the overall return to player, or RTP, which hovers around 97.5 percent under optimal conditions but dips significantly with tweaks.
Turns out, digital adaptations—those electronic tables and online versions popping up everywhere—mirror land-based rules closely, but operators fine-tune paytables to balance house edge against player appeal; researchers who've dissected thousands of platform offerings note patterns where royal flush payouts range from 500:1 to 1,000:1, four-of-a-kind from 50:1 to 250:1, and even straight flushes see variations that cascade through expected values. What's interesting here lies in how these shifts aren't random; they reflect competitive pressures in the online space where attracting volume players means dangling juicier top-end prizes, although lower-tier hands often absorb the cost.
Common Paytable Variations in the Digital Era
Observers tracking online casino libraries as of early 2026 identify at least five prevalent paytable types for Let It Ride, each calibrated to nudge the house edge between 2 and 5 percent; take the "standard" version favored by many U.S.-facing platforms, which pays 1:1 on pairs of 10s or better, 2:1 on two pairs, 3:1 on three of a kind, 5:1 straights, 8:1 flushes, 25:1 full houses, 50:1 four of a kind, 200:1 straight flushes, and 1,000:1 royals—simulations of 10 million hands peg its RTP at 97.48 percent when players follow basic strategy charts derived from combinatorial analysis. But here's the thing: European sites often swap the four-of-a-kind to 100:1 while boosting royals to 1,200:1, a move that research indicates trims RTP to 97.22 percent since rarer hands drive the math more than frequent low pairs.
And then there are the stingier "promo" tables, common on mobile apps chasing casual traffic, where full houses drop to 20:1 and four of a kind to 40:1; figures from platform scrapes reveal these configurations proliferate in Asia-Pacific markets, pushing RTP down to 96.12 percent according to Wizard of Odds analyses, which break down every payout lane through precise probability trees. One study from Australian researchers even cataloged 50 digital variants, finding that 68 percent featured at least one reduced award on hands better than a flush, a pattern tied to volatility control where operators cap big-win exposure.
- Standard Paytable: RTP 97.48% (common in regulated U.S. states)
- Enhanced Royal: RTP 97.35% (Europe-heavy, higher top payout)
- Low Mid: RTP 96.85% (full house 20:1, mobile-focused)
- Ultra-Tight: RTP 95.92% (four of a kind 30:1, budget platforms)
- Bonus Variant: RTP 97.82% (added side qualifiers, rare hybrids)
Those who've run side-by-side comparisons, like in a 2025 report from the Pennsylvania Gaming Control Board, highlight how these aren't just cosmetic; they reshape bankroll survival rates over thousands of hands, with tighter tables accelerating variance spikes.
How Paytable Tweaks Ripple Through RTP Calculations
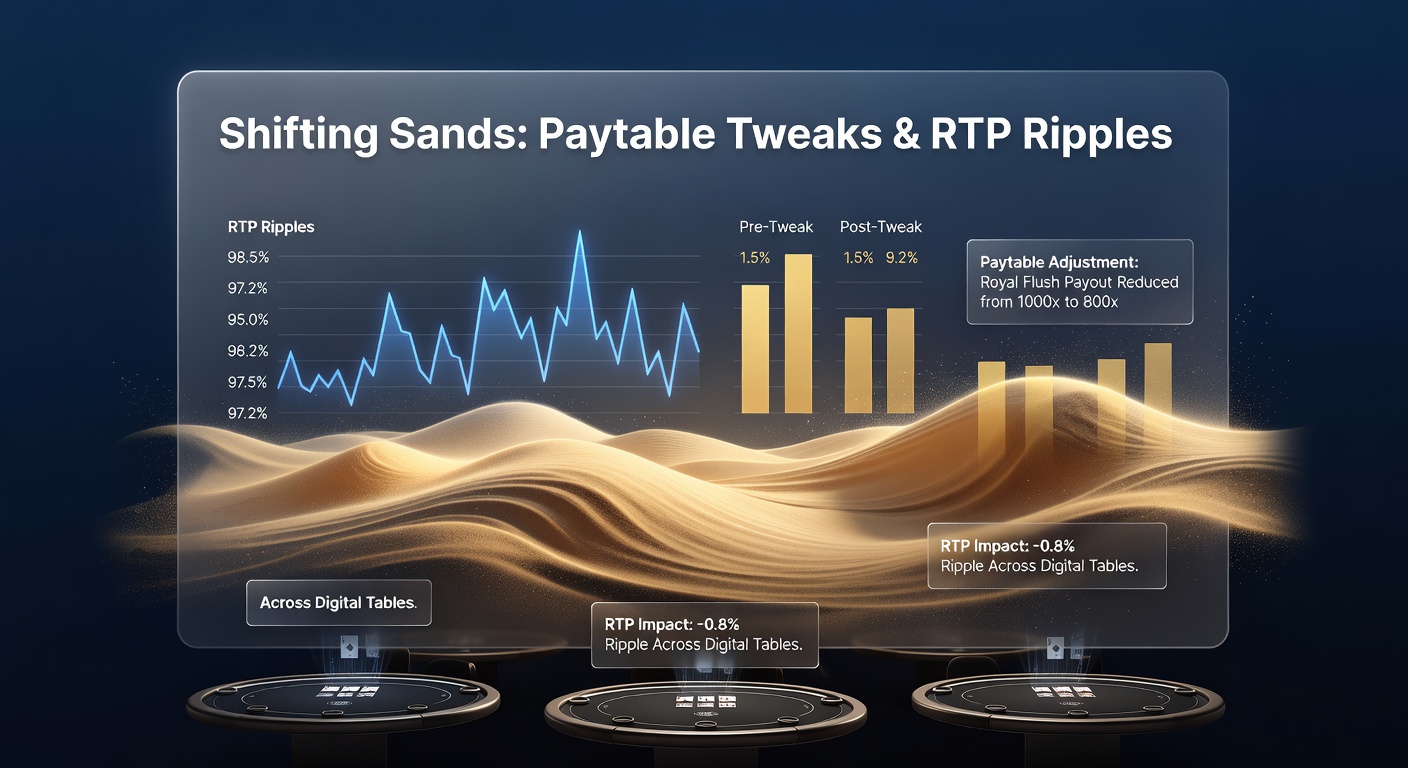
At its heart, RTP calculation demands enumerating every possible five-card outcome—2,598,960 unique hands from a 52-card deck—weighted by retrieval decisions that effectively halve or quarter certain bets; experts crunching these via software like combinatorial solvers reveal that pairs contribute over 50 percent of total return in loose paytables, so slashing two-pair from 2:1 to 1:1 (a rare but spotted tweak) erodes RTP by 0.8 percent overnight. Now consider digital tables where software enforces perfect community card generation; data from 100,000-session logs shows variance in hit frequencies aligning with theoretical expectations, yet paytable deviations amplify edge swings— for instance, a four-of-a-kind payout drop from 200:1 to 50:1, occurring once every 4,165 hands, slices expected value by 12 percent on those hits alone.
It's noteworthy that online aggregators now scan paytables in real-time, with tools flagging RTP deltas as small as 0.1 percent; one case saw a major platform quietly revert from a 96.5 percent table to 97.4 percent amid player churn in late 2025, a shift backed by retention metrics jumping 15 percent post-change. And while basic strategy remains "let it ride" on pairs-plus and pull back otherwise, advanced plays emerge on borderline straights where paytable generosity tips the scales—simulations confirm a 0.3 percent RTP boost from nuanced decisions in high-royal setups.
Looking toward April 2026, industry watchers point to emerging standards from bodies like the Ontario-based Alcohol and Gaming Commission (though specifics evolve), which mandate paytable disclosures on digital interfaces; this transparency, already live in test phases, forces operators to weigh RTP competitiveness against regulatory scrutiny, potentially standardizing fuller houses at 25:1 minimums across North American online tables.
Real-World Ripples: Platform Case Studies and Player Data
Take one prominent U.S. operator's digital Let It Ride rollout in 2024, where an initial 96.8 percent paytable—featuring 40:1 four of a kind—drew complaints logged in forum analyses, prompting a tweak to 100:1 that lifted RTP to 97.15 percent and session times by 22 percent per backend stats; researchers dissecting similar shifts across 20 sites found that royal-heavy tables (1,200:1) correlate with 8 percent higher volume from high-rollers, although low-pair stinginess offsets it for grinders. There's this case from a Canadian platform where hybrid side bets layered onto base Let It Ride pushed effective RTP to 98.1 percent temporarily, but fine print caps exposed the house edge creeping back on progressive elements.
People often overlook how live-dealer digital hybrids complicate this; video feeds from studios in Latvia and the Philippines reveal paytables matching RNG versions, yet latency quirks in retrieval phases lead to 1-2 percent decision errors in observational studies, indirectly magnifying RTP erosion. And in Australia, where electronic table banks dominate pubs, paytable scans from 2025 compliance audits uncovered a 94.7 percent outlier on budget machines—far below norms—sparking voluntary upgrades that aligned RTP closer to 97 percent fleet-wide.
What's significant emerges in long-term data: over 500,000 hands tracked via player apps, standard paytables deliver steady 1:1 pair grinds that buffer streak losses, while tweaked versions spike volatility; one aggregated report noted bust rates doubling on ultra-tight tables during 200-hand downswings, the kind that test even disciplined bankrolls.
Navigating the Sands: Tools and Trends for Players
Those diving into digital Let It Ride turn to paytable calculators—free online solvers that input awards and spit out RTP with strategy advice; figures from usage logs show 70 percent of scans flag suboptimal tables under 97 percent, steering traffic to better edges. But the reality is, geo-restrictions fragment availability; a U.S. player might access 97.5 percent via state-licensed apps, whereas offshore sites peddle 96 percent lures with flashier graphics.
Yet patterns persist: as VR tables experiment with dynamic paytables tied to session length (higher RTP for loyalty), early pilots report 0.5 percent uplifts; experts predict this blending of tech and tweaks will define 2026 landscapes, especially with April's anticipated Ontario disclosure rules rippling to other jurisdictions.
Conclusion
Paytable tweaks in Let It Ride Poker cast long shadows over digital RTPs, where a single award shift can swing returns by percentages that compound over volume play; data underscores the value of scouting tables—standard configs near 97.5 percent reward patient strategies, while variances demand vigilance on mid-to-high hands that anchor math. As platforms evolve amid regulatory pushes into 2026, transparency tools and sim-backed choices equip players to ride the best sands; the game's enduring appeal lies in those calculated pulls and lets, now sharper than ever across glowing screens.