Networked Progressive Systems Shift RTP Calculations in Blended Slot and Table Game Setups
Freya Roth · May 19, 2026
Networked Progressive Systems Shift RTP Calculations in Blended Slot and Table Game Setups
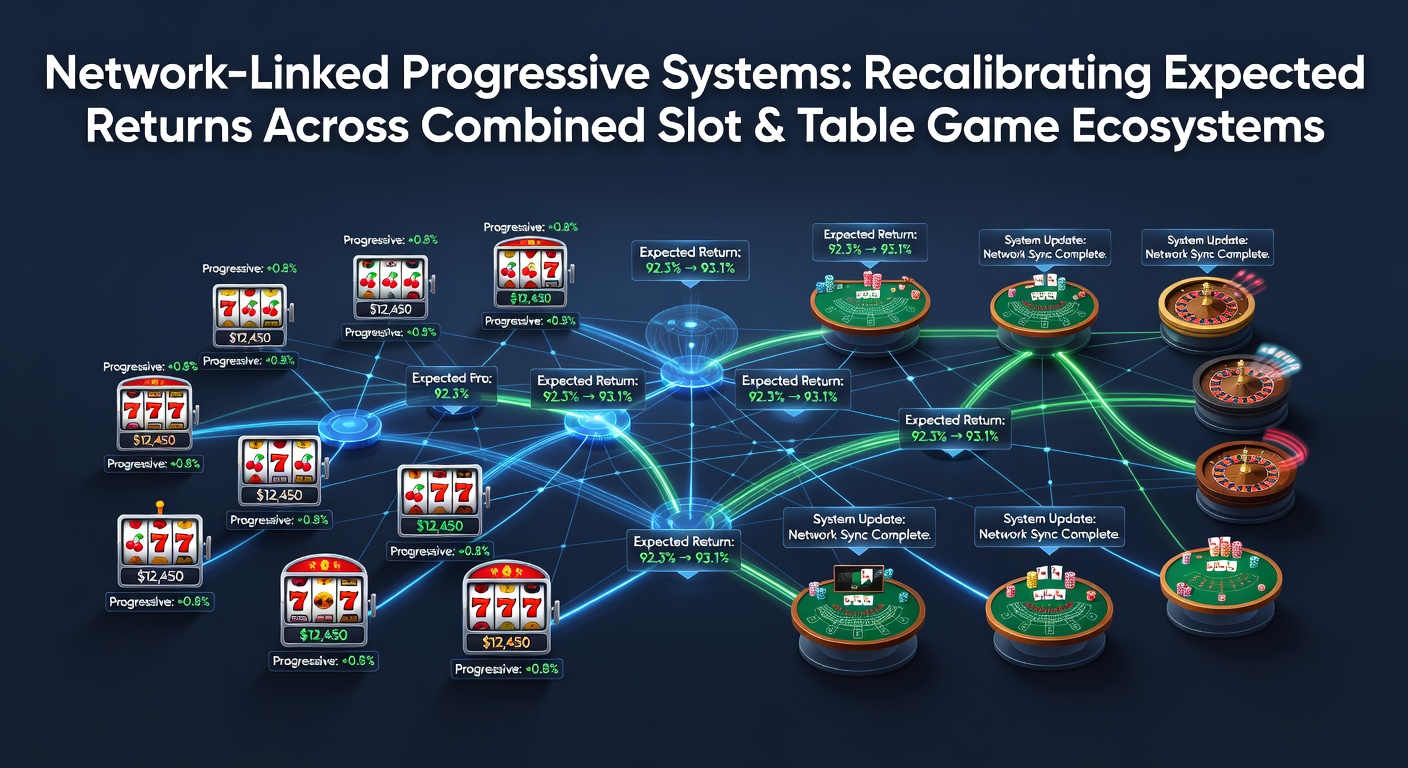
Network-linked progressive systems connect multiple gaming devices across casinos or even regions to build shared jackpot pools that grow with each wager and these connections change how expected returns get calculated in environments that mix slots with table games. Data from industry reports shows the contribution percentages from each bet feed directly into the progressive meter while simultaneously adjusting the base return to player figures for the underlying games and operators track these shifts through centralized systems that update in real time.
Operators deploy these networks primarily on slot machines where a small percentage of every spin adds to the jackpot but recent integrations extend the same mechanics to select table games such as certain poker variants and blackjack side bets. Research indicates the recalibration happens because the progressive component pulls from the overall house edge which means the non-progressive portion of the game often runs at a slightly lower RTP to compensate for the growing prize pool and players encounter this adjustment across combined floors where slot play and table sessions contribute to the same meter.
Mechanics Behind Cross-Game Contribution and Meter Growth
Each participating device sends a fixed or variable percentage of wagers into the network pool and the system distributes contributions according to predefined algorithms that account for game type and wager size. Studies from gaming laboratories reveal slots typically contribute between 1 and 3 percent of coin-in while table game side bets may route 2 to 5 percent depending on the jurisdiction and this variance creates different growth rates for the meter when both game categories operate on the same network.
One documented setup at a multi-property operator in the United States illustrated how table game contributions accelerated meter growth by 40 percent during peak hours because higher average bets on blackjack side bets outpaced slot contributions per minute and the network software automatically adjusted displayed RTP estimates for both game types to reflect the updated prize values. The process maintains transparency through player-facing meters that update every few seconds while backend systems recalculate expected returns using formulas that factor in jackpot probability and current pool size.
Impact on Expected Returns Across Hybrid Gaming Ecosystems
Expected returns in these combined ecosystems incorporate both the base game RTP and the added value from progressive opportunities yet the overall figure fluctuates as the jackpot rises and falls. Figures from regulatory filings indicate the effective RTP can climb above the base rate once the progressive prize exceeds certain thresholds because the probability-weighted value of hitting the jackpot offsets the reduced base return and this effect appears more pronounced when slots and table games feed the same pool since the combined volume drives faster meter increases.
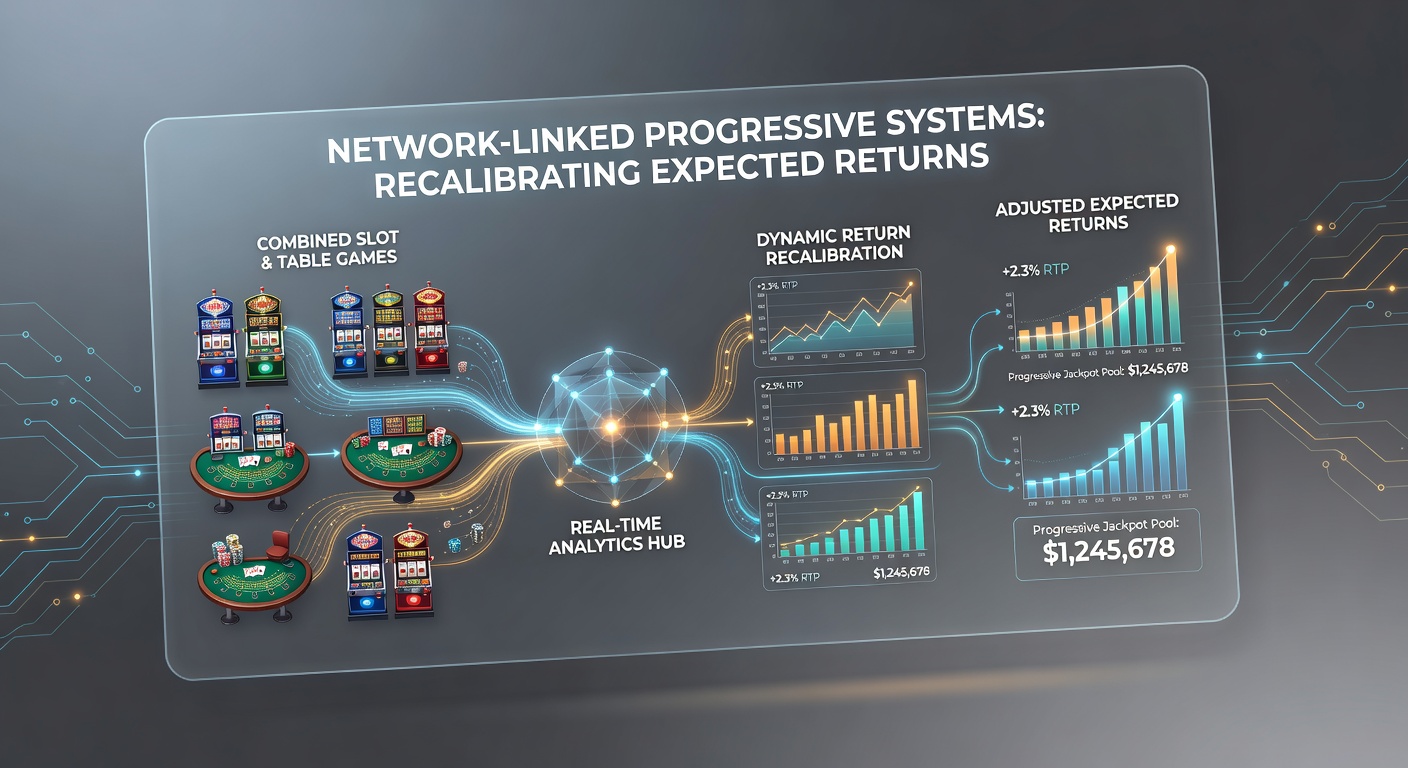
Analysts note that volatility rises alongside these adjustments because larger jackpots arrive less frequently while smaller base game payouts remain consistent and data from simulation models shows players experience longer dry spells between significant wins when participating across both slots and tables on linked networks. The recalibration remains most visible during promotional periods when operators temporarily boost contribution rates to accelerate meter growth and these changes get communicated through updated paytable information displayed at each terminal.
Regional Examples and Data Patterns Observed in 2026
Operators in Nevada reported measurable shifts in overall hold percentages after expanding progressive networks to include table game side bets in early 2026 and records show the combined ecosystems produced steadier meter growth compared with slot-only configurations. A similar pattern emerged in Australian venues where linked progressives across electronic table games and slot banks led to recalibrated return figures published in quarterly compliance documents and these updates reflected the higher contribution volumes from mixed wagering activity.
What's interesting here is how software platforms handle the mathematical balancing act by running continuous simulations that project long-term returns based on current meter levels and historical contribution rates. Observers note one major supplier released an updated protocol in May 2026 that allowed finer control over contribution splits between slot and table segments which helped operators maintain target RTP ranges while still growing attractive jackpots and the change spread quickly among properties seeking regulatory approval for hybrid progressive setups.
Regulatory Oversight and Compliance Considerations
Regulatory bodies such as the Nevada Gaming Control Board require operators to submit detailed reports on how progressive networks affect game mathematics and these filings must demonstrate that recalibrated expected returns stay within approved limits even as jackpots fluctuate. Similar requirements appear in other jurisdictions where gaming control agencies mandate independent testing of the contribution algorithms and meter reset procedures to ensure fairness across all connected devices.
Testing laboratories verify that the combined ecosystems do not inadvertently push any single game type outside its approved RTP band and audits often examine thousands of simulated outcomes to confirm the network adjustments perform as documented. The process includes verification that players receive accurate information about current jackpot values and the corresponding impact on expected returns at the moment they place wagers.
Conclusion
Network-linked progressive systems continue to influence how expected returns get calculated when slots and table games operate within shared jackpot ecosystems and the adjustments reflect real-time contribution data from both game categories. Operators and regulators work together to maintain transparent reporting while the underlying mathematics accounts for meter growth rates and probability-weighted prize values. As more venues adopt these integrated networks the patterns in RTP recalibration become clearer through accumulated performance data and compliance records.